CryosphereComputing
by Nico Sun
The Website is dedicated to monitoring and analysing changes in the polar regions. Daily updated products include Sea Ice Area, Snow Cover, High Arctic Temperature data and a quantification of ocean warming from reduced sea ice (AWP).
Read more
Weekly updated are Antarctic Iceberg locations, speed and size. The Arctic also gets monthly Sea Ice Thickness updates with the AMSR2 product. The Analysis section covers long term trends, extremes and special visualizations.
For Earth's ice sheets current products include a thickness distribution, bedrock elevation overlayed on a true colorimage and a size comparison between glaciers.
Arctic Sea Ice
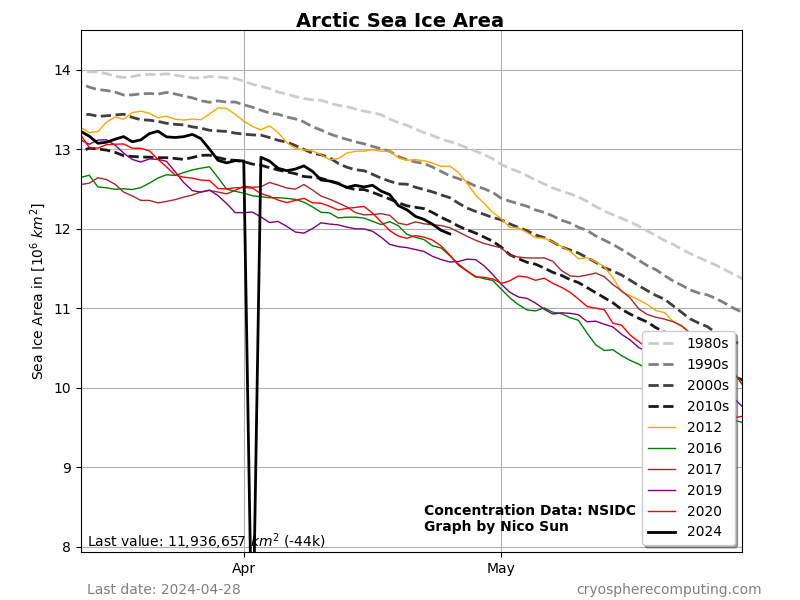
lowests minimum: 2.241 (2012), 2.477 (2016)
lowests maximum = 12.668 (2016), 12.761 (2017)
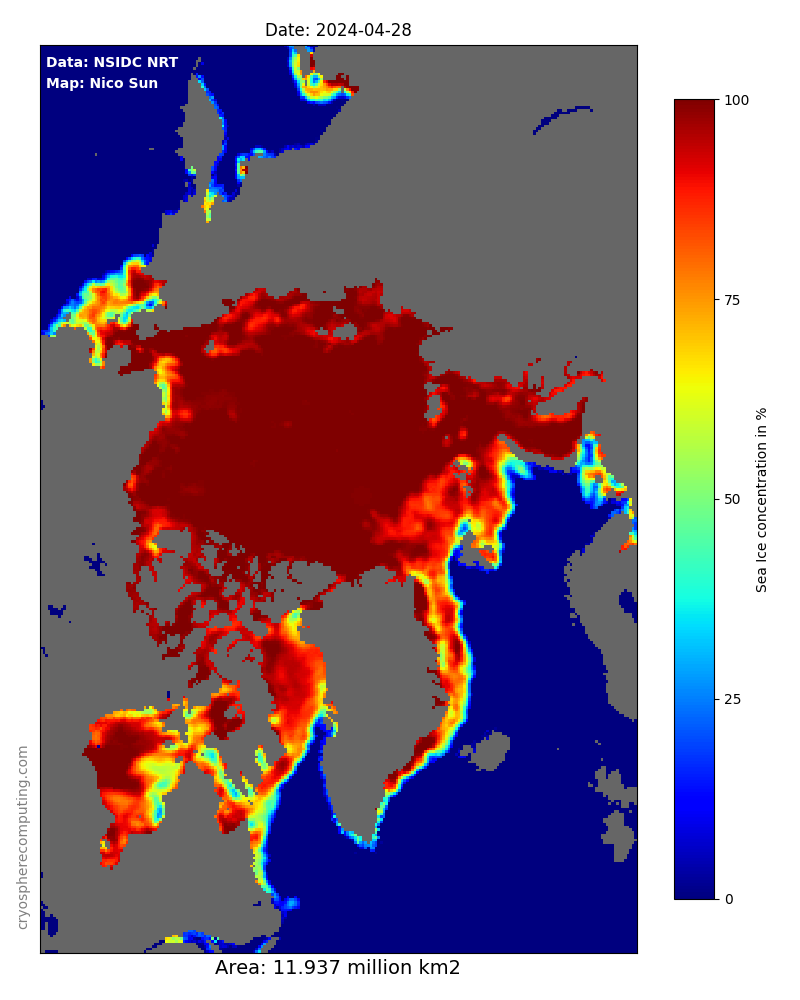
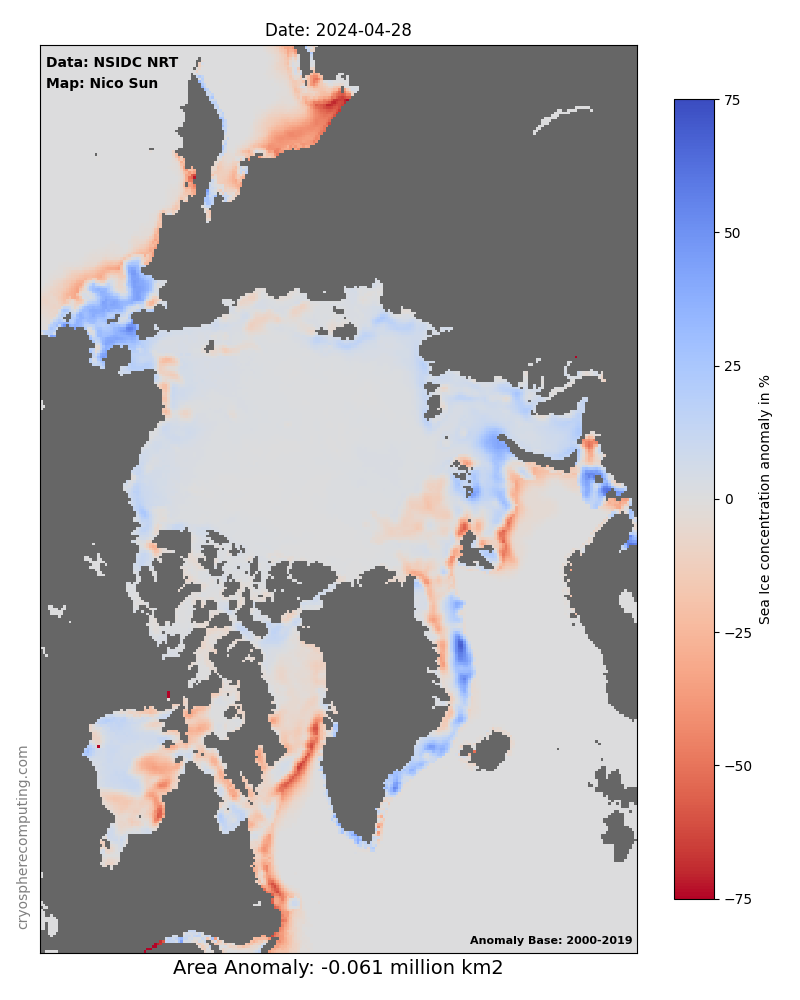
AMSR2 anomaly base is July 2012 to June 2023
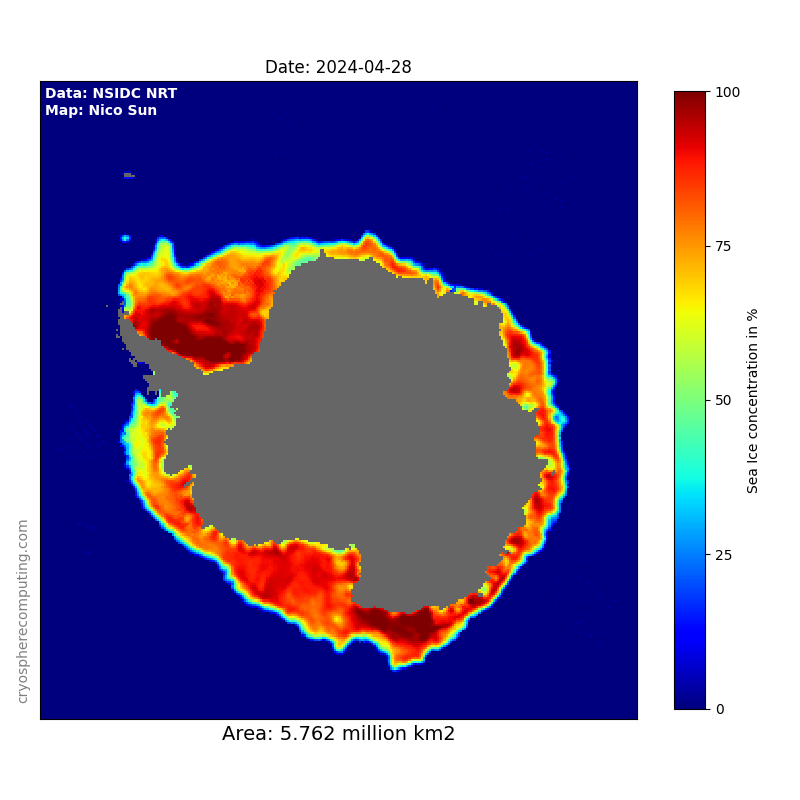
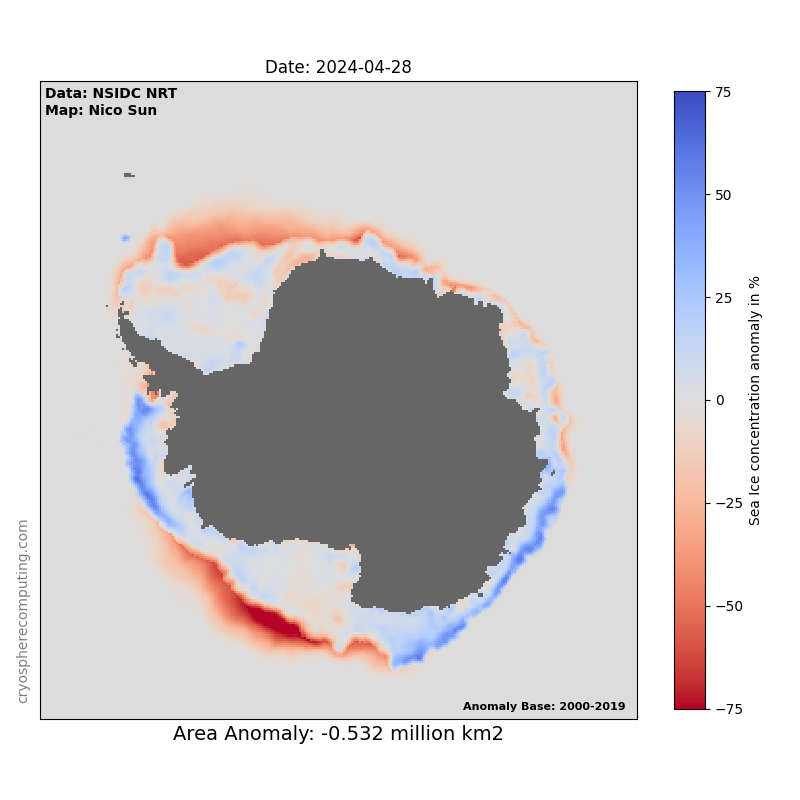
Antarctic Sea Ice
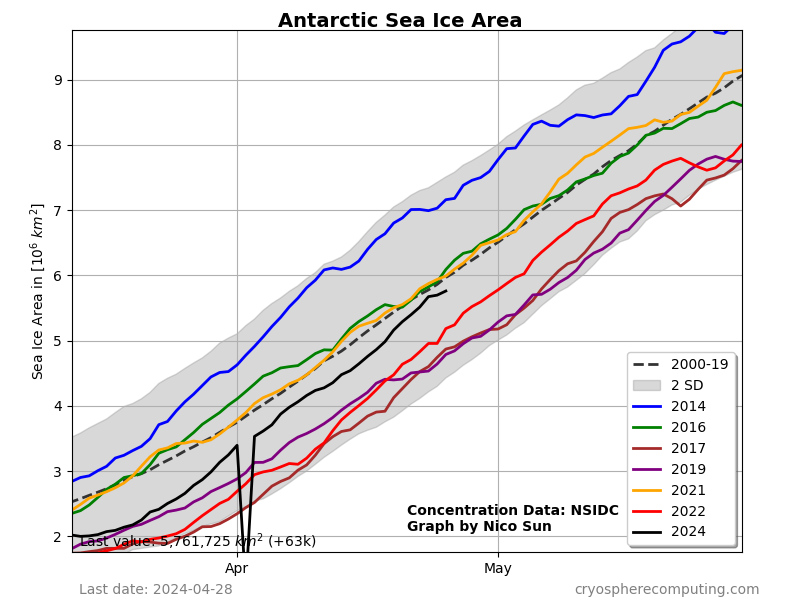
lowest minimum = 1.05 (2023 NRT), 1.246 (1993)
lowests maximum = 14.162 (1986), 14.195 (2017)
highest minimum = 2.438 (2015)
highest maximum = 16.324 (2014)
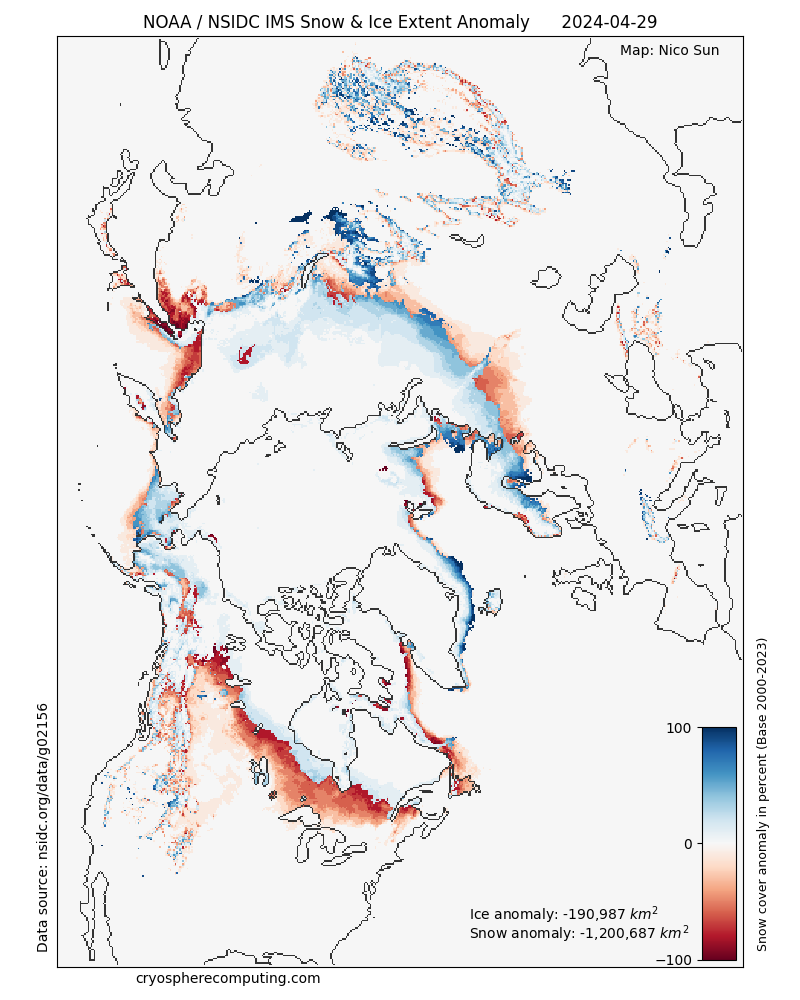
Northern Hemisphere Snow Cover
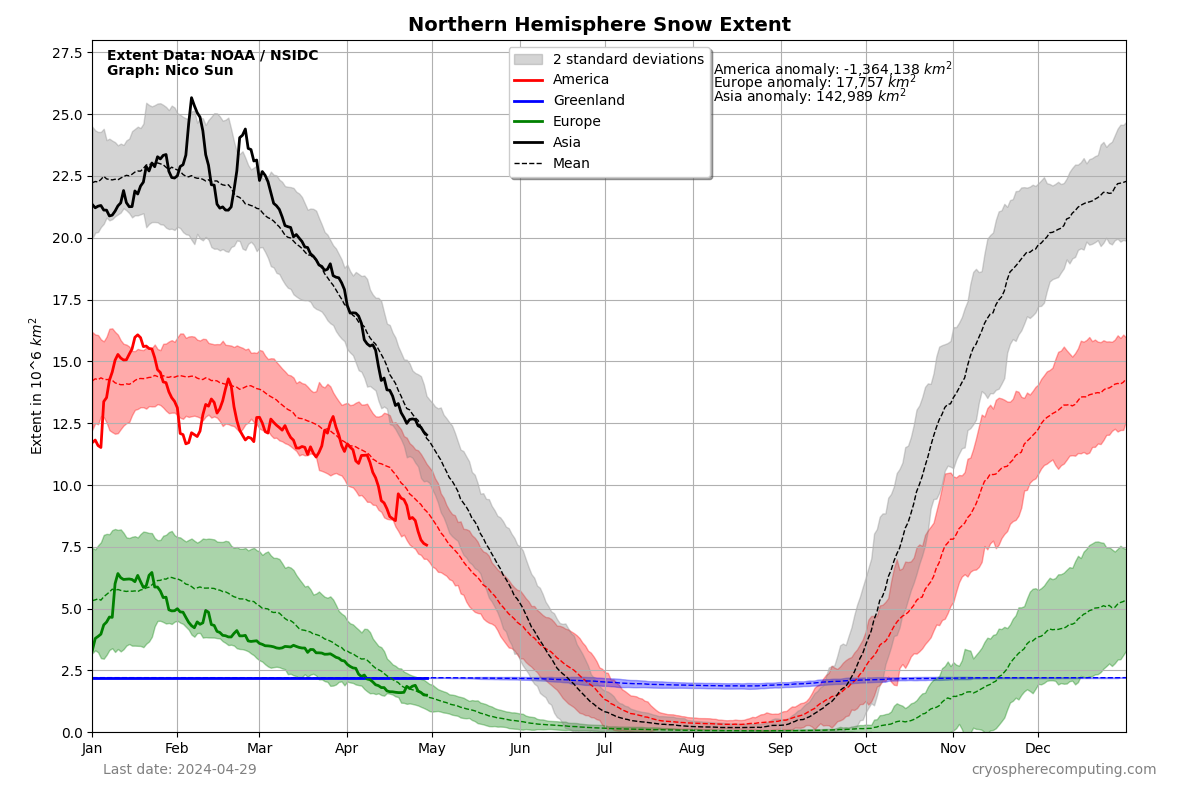
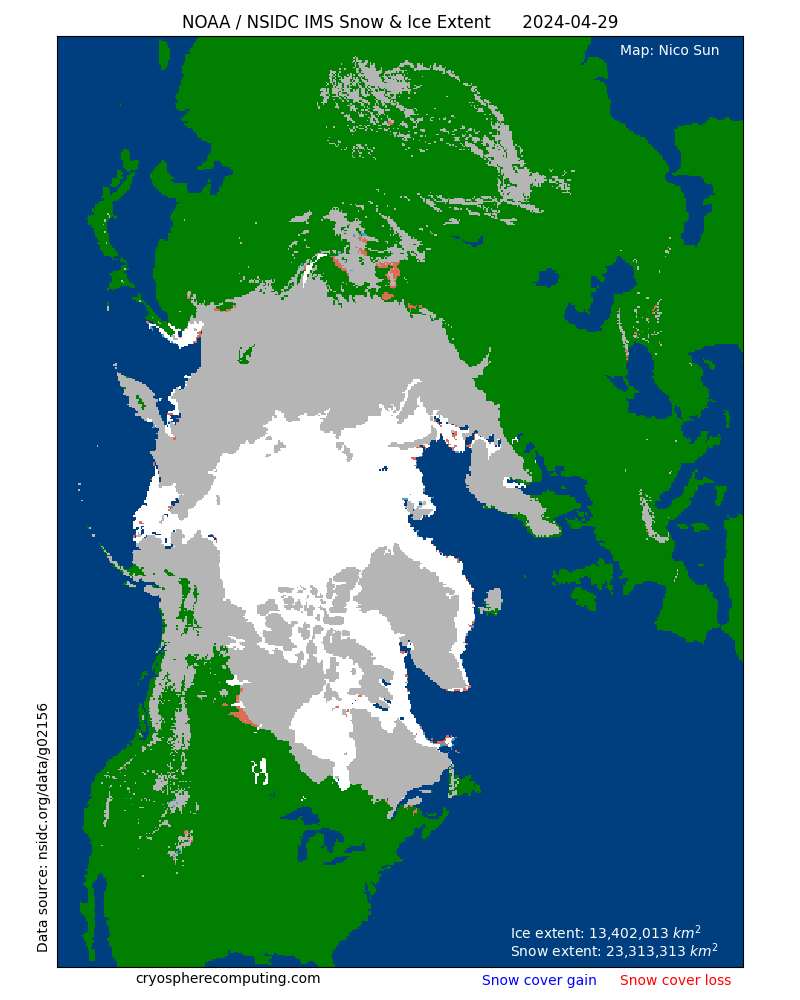
Highest Anomaly = +6.57 (2002-10-15), +6.54 (2009-02-14)
Lowest Anomaly = -6.86 (2005-11-13), -5.73 (2001-11-23)
Freezing Degree Days
FDD calculatorThe graphs show the Freezing Degree days over the whole freezing season.
The sea ice thickness can be estimated based on the following formula (Lebedev 1938)
Thickness (cm) = 1.33 * FDD (°C)^0.58
Data used
Cavalieri, D. J., C. L. Parkinson, P. Gloersen, and H. J. Zwally. 1996, updated yearly. Sea Ice Concentrations from Nimbus-7 SMMR and DMSP SSM/I-SSMIS Passive Microwave Data, Version 1.1 Boulder, Colorado USA. NASA National Snow and Ice Data Center Distributed Active Archive Center. doi: https://doi.org/10.5067/8GQ8LZQVL0VL.
National Ice Center. 2008, updated daily. IMS Daily Northern Hemisphere Snow and Ice Analysis at 1 km, 4 km, and 24 km Resolutions, Version 1.1-1.3. Boulder, Colorado USA. NSIDC: National Snow and Ice Data Center. doi: https://doi.org/10.7265/N52R3PMC.