Ice Melting Arctic Albedo-Warming Potential
Beta phase product. May change slightly
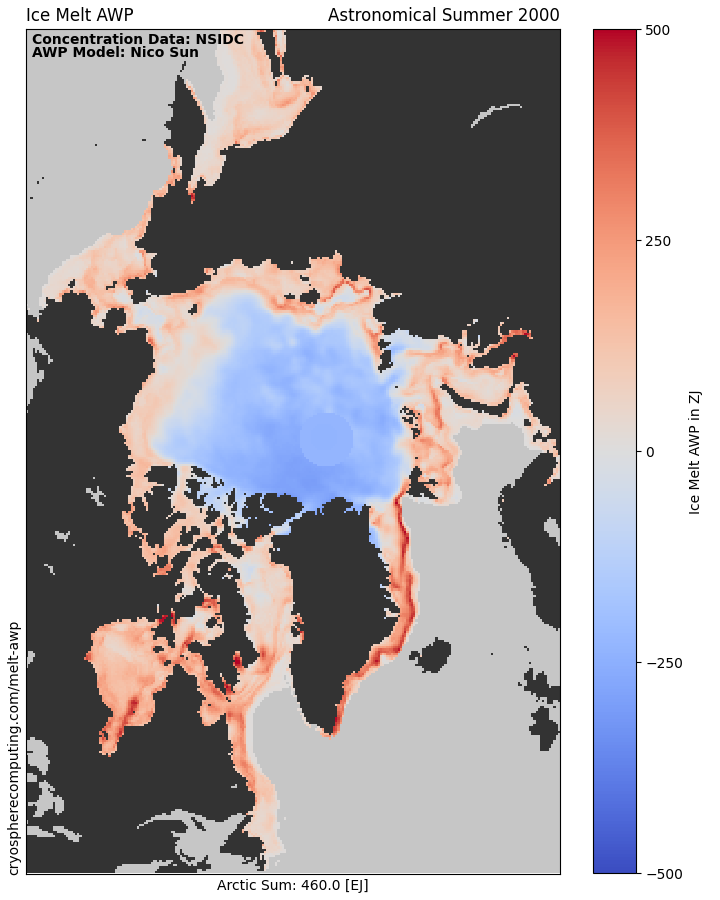
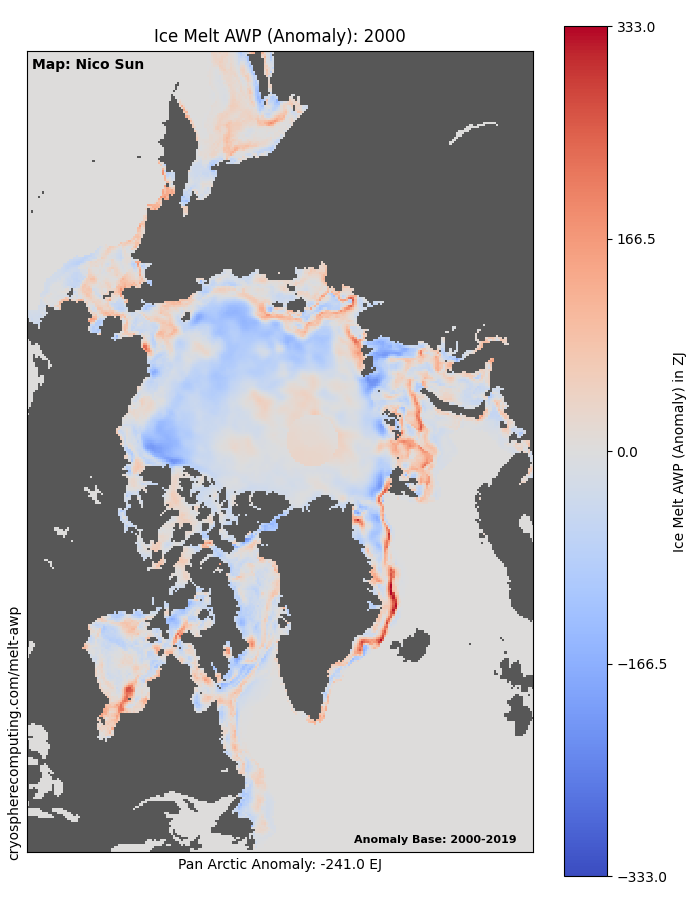
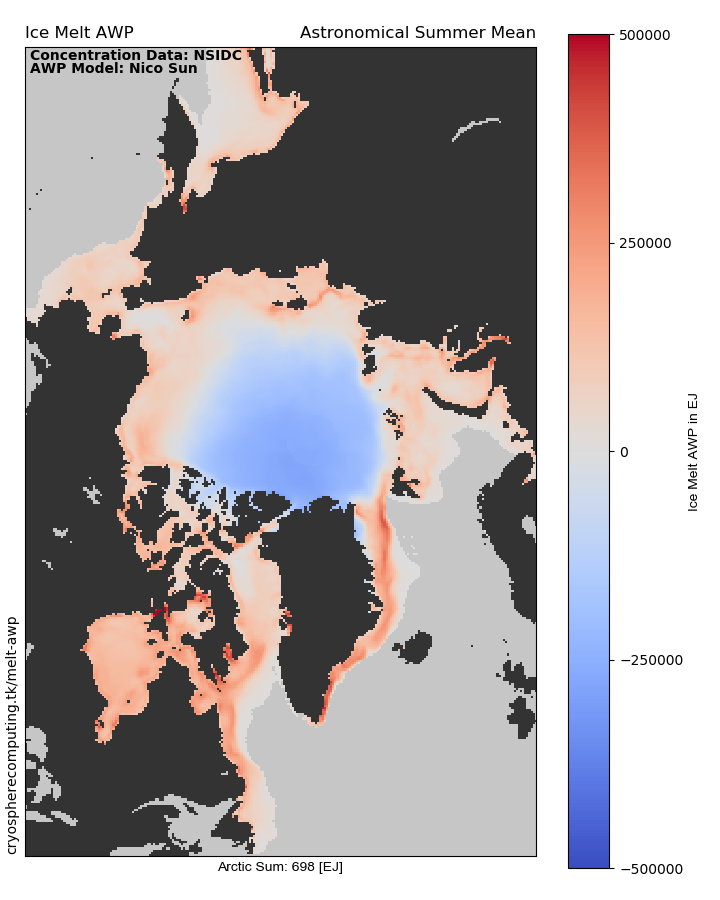
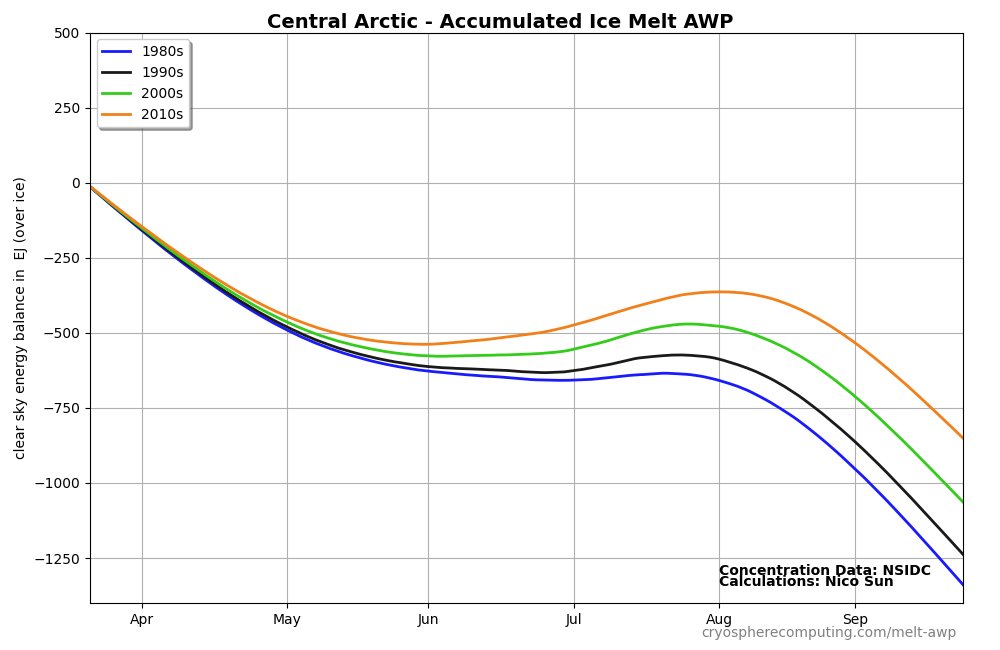
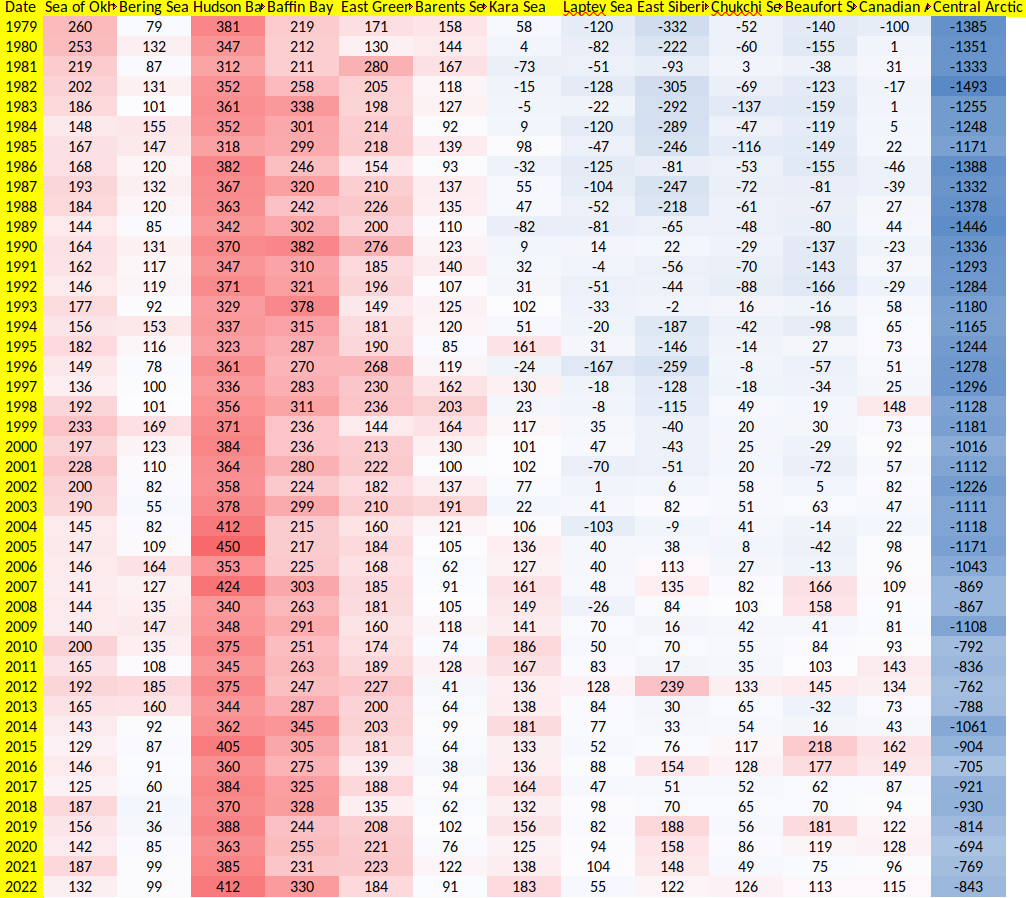
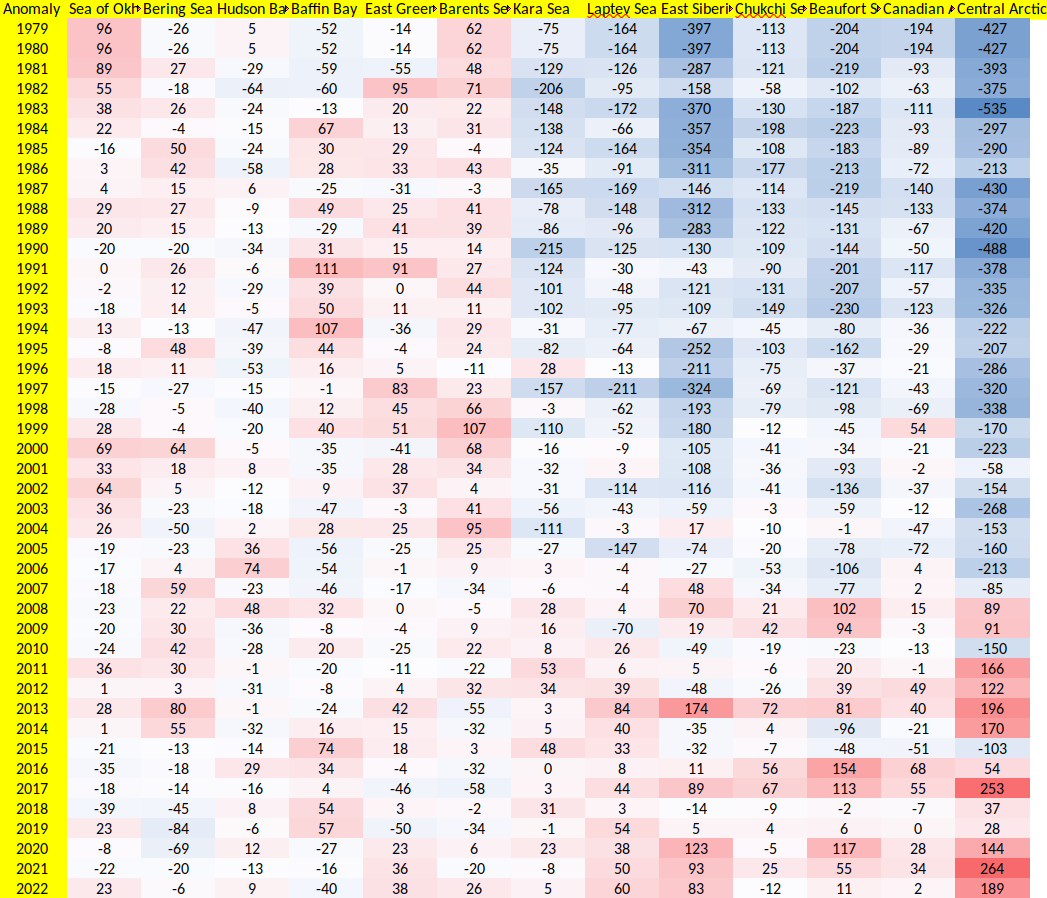
The Ice-Melt AWP is the AWP model applied only over a sea ice concentration of 25% or more. Ice-free regions do not accumulate anything
as there is no ice to melt. Instead of an area unit (MJ per m2) ice-melt AWP is measured in an absolute energy value Exajoule (EJ). This change better reflects the larger melting potential of large regions.
Counting AWP only over sea ice results in low values appearing both in warm and cold regions. In a warm region there is no ice to melt at all. In cold regions with high ice concentration
and a high albedo the ice doesn’t absorb much sunlight and melting from sunshine remains low throughout the summer.
The conditions in regions with high values are dispersed sea ice, melt ponds and the ice edge. Due to the sensor limitations and large grid cell size the
sea ice edge does show exaggerated values. Grid cells near the coast experience a coastline measurement error. To reduce this noise the lower limit of
sea ice concentration was chosen to be 25% and not 15% as used in sea ice extent measurements.
Additionally, this model includes heat loss to space. Around 4-6 MJ/m2/day depending on the month and CO2 level. The level of heat loss was chosen to be the same
as in my Sea Ice Forecast model submitted to the Sea Ice Prediction Network. This heat loss adjustment per CO2 level is necessary to avoid over prediction
of ice loss in the 1980s and under prediction of ice loss in the 2000s and 2010s. In the model the late 2010s at around 410ppm have an 11% reduced heat loss
compared to the early 1980s 340ppm.
see June 2020 forecast(Nico Sun)
Heatloss example (per day per m2):
Temp(K): MJ @ 400ppm CO2
250: 4.14
260: 4.82
270: 5.60
274: 5.94
The model’s main purpose is to visualise where melt happened and rank years accordingly. Apart from comparison to other years I would not put any other use case into
the presented values. Especially relating negative values with freezing conditions. It is still not even close to a volume model. For sea ice volume we already have
PIOMAS, Cryosat2 and my AMSR2 Snow & Ice Volume.
Datasheets:
https://github.com/NicoSun/ScienceData/tree/master/Ice_Melt_AWP
Climatology charts
Regional charts
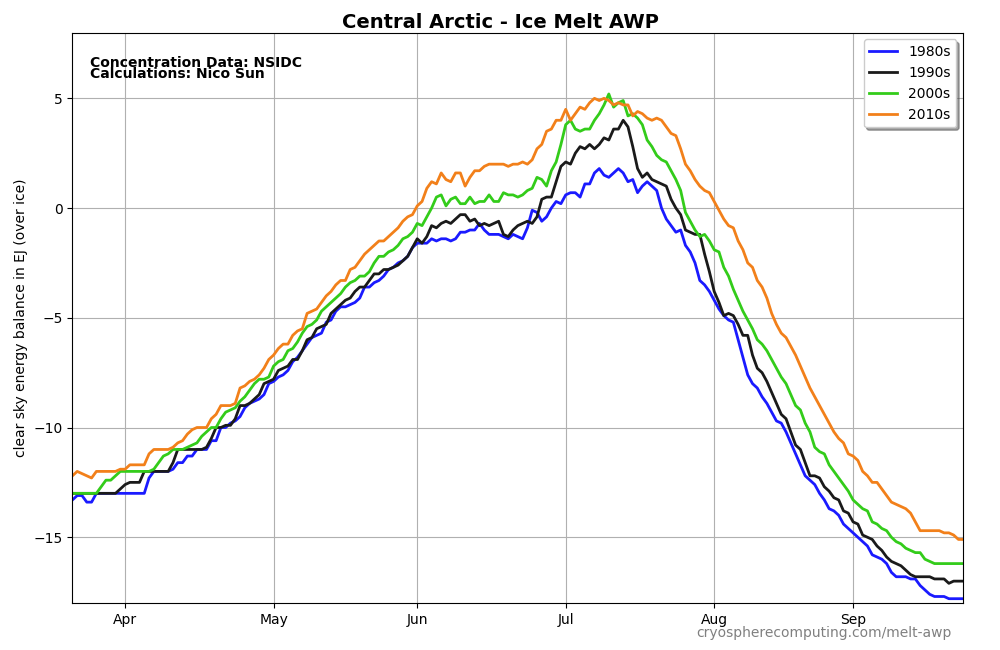
Data used
Cavalieri, D. J., C. L. Parkinson, P. Gloersen, and H. J. Zwally. 1996, updated yearly. Sea Ice Concentrations from Nimbus-7 SMMR and DMSP SSM/I-SSMIS Passive Microwave Data, Version 1.1 Boulder, Colorado USA. NASA National Snow and Ice Data Center Distributed Active Archive Center. doi: https://doi.org/10.5067/8GQ8LZQVL0VL.