Arctic Albedo-Warming Potential
Quantifying ocean warming from reduced sea ice
For a full description see the documentation page.


Select individual years with the slider to view the difference with the new millenia baseline of 2000-2019. Regions with a high coastline to area ratio have been removed from the calculation (only visible on the map) to reduce noise. Specifically all lakes, the Baltic Sea and the Gulf of St. Lawrence.
In the charts below click on the legend to deselect a series.

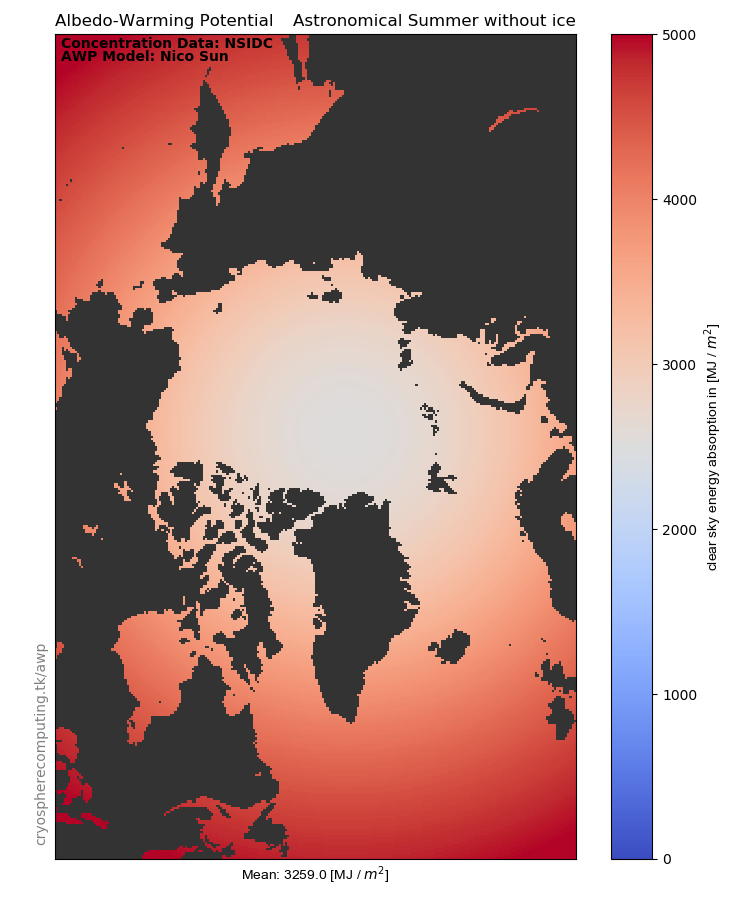
The maximum accumulated solar radiation varies greatly by latitude when taken over the whole astronomical summer. At the north pole the max is 2500MJ/m2, at 75N it is 3000MJ/m2, at 60N 4000MJ/m2 and at 44N 5000MJ/m2. That's why on the map with raw energy values the Arctic appears significantly bluer than the south, even when regions are mostly icefree. Instead of energy values the chart on the left shows the percentage of locally avaliable solar radiation.
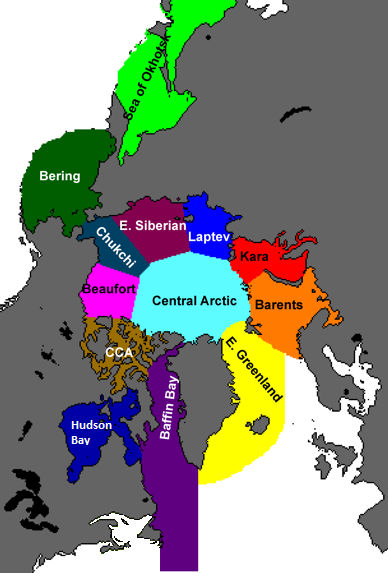
High Arctic
includes only the following regions: Kara Sea, Laptev Sea, East Siberian Sea, Chukchi Sea, Beaufort Sea, Canadian Archipelago, Central Arctic
Data used
Cavalieri, D. J., C. L. Parkinson, P. Gloersen, and H. J. Zwally. 1996, updated yearly. Sea Ice Concentrations from Nimbus-7 SMMR and DMSP SSM/I-SSMIS Passive Microwave Data, Version 1.1 Boulder, Colorado USA. NASA National Snow and Ice Data Center Distributed Active Archive Center. doi: https://doi.org/10.5067/8GQ8LZQVL0VL.